
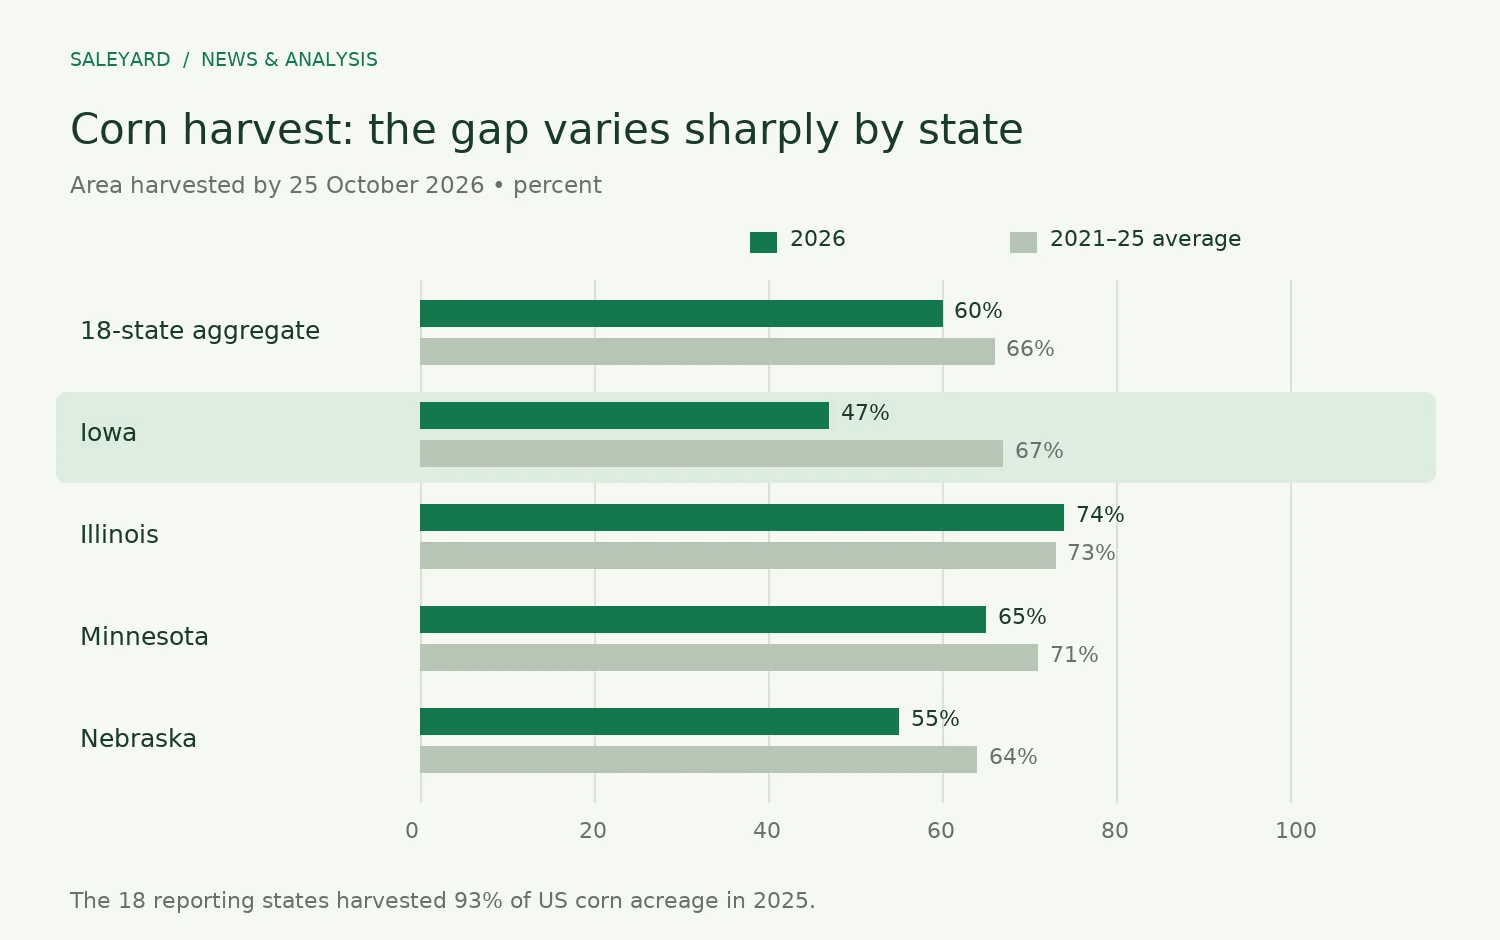
The US corn harvest has moved forward sharply, but the latest figures reveal a much larger delay in one key state than the headline suggests. USDA’s 26 October Crop Progress report puts harvest at 60% across its 18 reporting states, up from 44% a week earlier and below the five-year average of 66%. [1]
Iowa was only 47% harvested against an average of 67%. Illinois, by contrast, was at 74%, slightly ahead of its usual 73%. For New Zealand feed buyers, that uneven picture is useful context for overseas grain supply. It is not evidence that a local feed quote must rise. [1]
A fast week has not removed every delay
The aggregate advanced 16 percentage points in seven days, while Iowa advanced 21 points. Minnesota reached 65% against an average of 71%, and Nebraska 55% against 64%. The reporting states accounted for 93% of US corn acreage harvested in 2025. [1]
View chart data
| Scope | Harvested 2026 (%) | 2021–25 average (%) |
|---|---|---|
| 18-state aggregate | 60 | 66 |
| Iowa | 47 | 67 |
| Illinois | 74 | 73 |
| Minnesota | 65 | 71 |
| Nebraska | 55 | 64 |
Harvest progress measures area completed, rather than the tonnes ultimately available to buyers. A delayed harvest can still produce a sizeable crop. Conversely, a quick harvest does not prove a large yield. This report alone cannot establish an export shortfall or a change in New Zealand’s delivered feed costs.
Nor was every crop behind. Soybean harvest reached 79%, compared with a 77% average. Corn rated good or excellent totalled 56%, unchanged from the preceding week. Those condition categories are assessments of the standing crop, not a fresh tonnage forecast. [1]
The New Zealand connection runs through the delivered price
FAR’s 2024 maize market analysis provides useful background to that connection. It explains that New Zealand grain prices can move differently from overseas markets because local conditions matter, while the availability of cheaper imported grain can put pressure on domestic prices. Dairy-sector demand is another part of the local market. [2]
That creates two sides to the same international signal. A livestock farmer buying grain wants competitively priced feed. A local maize grower needs a return that covers production and delivery. The overseas harvest is relevant to both businesses, but neither can read their final margin directly from a US percentage.
An imported ingredient also has to reach the farm. Commodity price, currency conversion, transport and the supplier’s commercial terms sit between a foreign crop report and a New Zealand quote. Even if the overseas commodity becomes cheaper, another part of that chain can offset the benefit. That is a pricing mechanism, not a claim that those costs have changed this week.
Compare feed value, not just a price per tonne
DairyNZ’s Supplement Price Calculator starts with the price delivered per tonne, then considers dry matter, metabolisable energy and feed composition. It also uses farm inputs including milk price and post-grazing residuals. Its model assumes energy is the first limiting nutrient and is designed for comparisons, rather than balancing a ration. [3]
For a buyer seeking quotes now, the useful comparison is therefore the same delivery period, an agreed specification and the cost of usable feed. A lower wet-weight price is not automatically better value if the feeds differ in dry matter, energy or their role in the system. The farm’s expected response matters alongside the invoice.
The next US progress report will help show whether the remaining harvest gap is closing. Local price offers will show whether that overseas supply picture is translating into an opportunity here. Until both are visible, the defensible conclusion is narrower: harvesting accelerated, regional delays remain, and New Zealand feed budgets still need local numbers.