New Zealand’s August export result looks strong at first glance. Goods exports reached $6.7 billion, up $888 million, or 15%, from August last year. Meat and dairy both contributed, but the detail inside the dairy figures shows why a higher export total should not automatically be read as a higher commodity-price signal. [1]
Meat and edible offal exports rose $144 million, or 23%. Milk powder, butter and cheese rose $84 million, or 7.6%, to $1.194 billion. Those are useful earnings gains for the country. For farm decisions, however, the route to the gain matters: more product sold and a higher price per unit have different implications for demand, inventories and the durability of returns. [1]
View chart data
| Product | Export value change % | Quantity change % | Unit price change % |
|---|---|---|---|
| Milk powder | 25 | 26 | -0.6 |
| Milk fats (including butter) | -19 | -9.6 | -11 |
| Cheese | 24 | 24 | -0.2 |
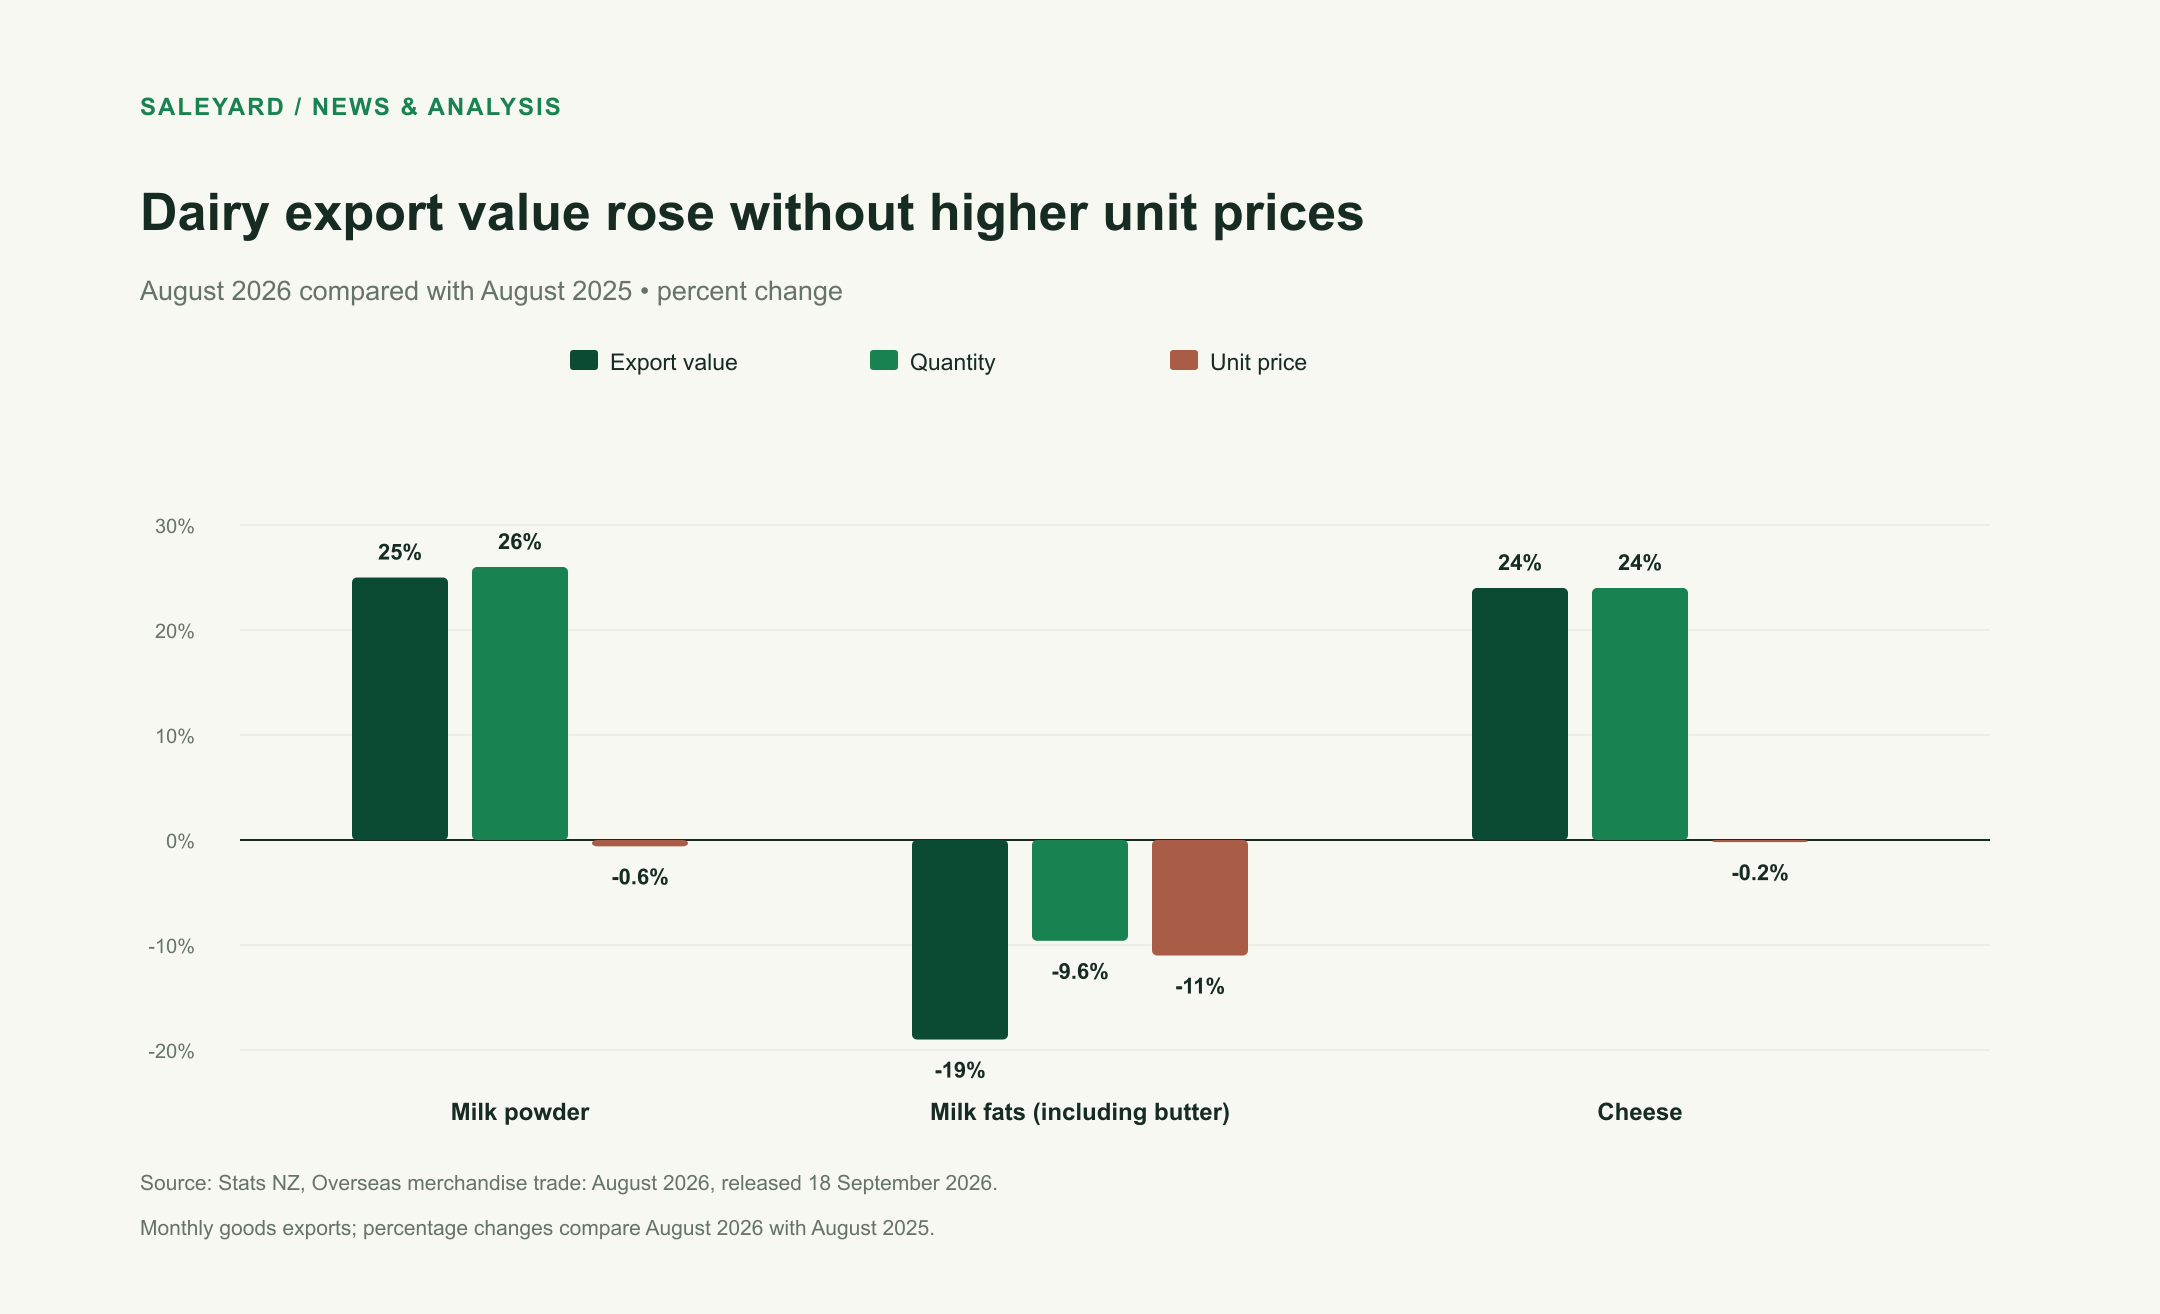
Milk powder provides the clearest example. Its export value rose 25% from August 2025, while quantity rose 26% and unit price slipped 0.6%. Cheese followed a similar pattern: value and quantity each increased 24%, but unit price eased 0.2%. In both cases, almost all the additional value came from volume rather than a better average price per unit. [1]
Milk fats, including butter, moved the other way. Export value fell 19%, quantity dropped 9.6% and unit price was 11% lower. The result was therefore weaker on both volume and price. Combining that movement with the powder and cheese gains produces a positive dairy total, but it hides materially different trading conditions across products. [1]
Export value is not a farmgate price
The distinction matters because export statistics and the farmgate milk price answer different questions. Stats NZ records the value and quantity of goods exported during the month. A dairy company’s farmgate calculation draws on its product mix, sales timing, currency conversion and costs across a season. August’s merchandise data do not say what any processor will finally pay for milk.
They also compare one month with the same month a year earlier. Shipment timing can make an individual month unusually strong or weak, particularly when product moves around the end of a reporting period. Stats NZ classifies the newest overseas merchandise trade data as provisional for three months, allowing late information and revisions to be incorporated. [2]
That does not make the figures unimportant. It changes the conclusion that can safely be drawn. August shows that exporters moved substantially more milk powder and cheese than a year earlier without receiving a higher average unit price. It is evidence of stronger shipment volume, not proof of a broad price lift. [1]
Meat strengthened while the US result split
The meat result was more clearly positive at the aggregate level, with value up 23%. Stats NZ’s headline release does not provide the matching quantity and unit-price breakdown for meat, so it cannot tell us from these figures alone how much came from price and how much from volume. That is a limit worth keeping in view when comparing the dairy and meat numbers. [1]
The country detail adds another layer. Total exports to the United States fell $52 million, or 6.6%, yet meat and edible offal exports to that market rose $32 million. Dairy exports in the milk powder, butter and cheese group fell $31 million, while casein and caseinates fell $43 million. One weak destination total therefore contained a stronger meat line and weaker dairy lines. [1]
China moved in the opposite direction. Total exports rose $191 million, or 16%, including a $37 million increase in milk powder, butter and cheese. That is supportive for dairy export demand, but the national product data still show the extra powder and cheese value being generated by volume rather than a higher unit price. [1]
The input-cost headline also needs care
Fertiliser imports fell $105 million, or 48%, from August last year. It would be tempting to translate that into cheaper fertiliser on farm, but the release does not support that conclusion. Import value can fall because less product arrived, because prices changed, because the product mix changed or because shipments landed in another month. A monthly border value is not a retail price index. [1]
For the same reason, August’s $1.3 billion trade deficit should not be treated as a verdict on agriculture. Goods imports rose 13% to $8.0 billion, faster in dollar terms than exports. Petroleum, vehicles and machinery were among the large increases. The balance describes the whole merchandise economy, while farm returns depend on specific products, markets and costs. [1]
What to watch from here
The next test is whether the volume-led dairy gains persist and whether unit prices begin to strengthen with them. Repeated months of higher powder and cheese shipments would provide more confidence than a single comparison. A lift in unit values would offer a different signal again, particularly if it appeared across more than one product and destination.
For red-meat producers, the August release supports the view that export earnings remained firm, including into the United States, but it does not replace processor schedules or detailed volume data. The useful follow-up is to compare later trade releases with plant demand and the prices available for the relevant class of stock.
August was a good month for export receipts. The more precise reading is that meat value rose strongly and dairy value increased despite flat-to-lower unit prices in the major products Stats NZ itemised. That is encouraging for throughput and market access. It is a weaker basis for assuming that higher export totals will flow directly into better per-unit returns on farm.